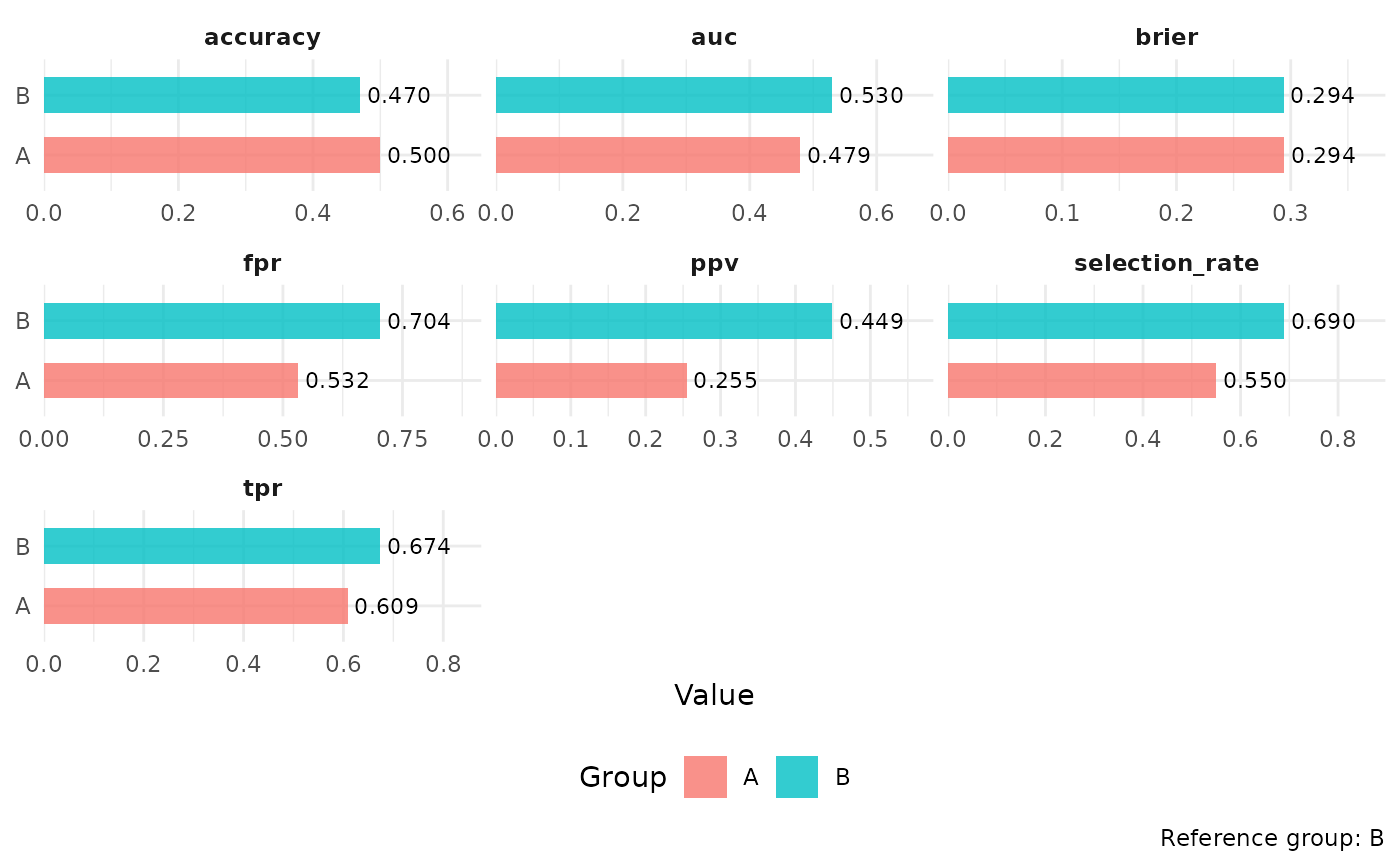
Plot fairness metrics disparity
Usage
# S3 method for class 'fairness_metrics'
autoplot(object, type = c("disparity", "roc", "calibration"), ...)
Arguments
- object
A fairness_metrics object.
- type
Plot type: "disparity" (default), "roc",
or "calibration".
- ...
Additional arguments (unused).
Examples
# \donttest{
set.seed(42)
fd <- fairness_data(
  predictions = c(runif(100, 0.2, 0.8), runif(100, 0.3, 0.9)),
  labels = c(rbinom(100, 1, 0.3), rbinom(100, 1, 0.5)),
  protected_attr = rep(c("A", "B"), each = 100)
)
fm <- fairness_metrics(fd)
autoplot(fm)

# }
# }