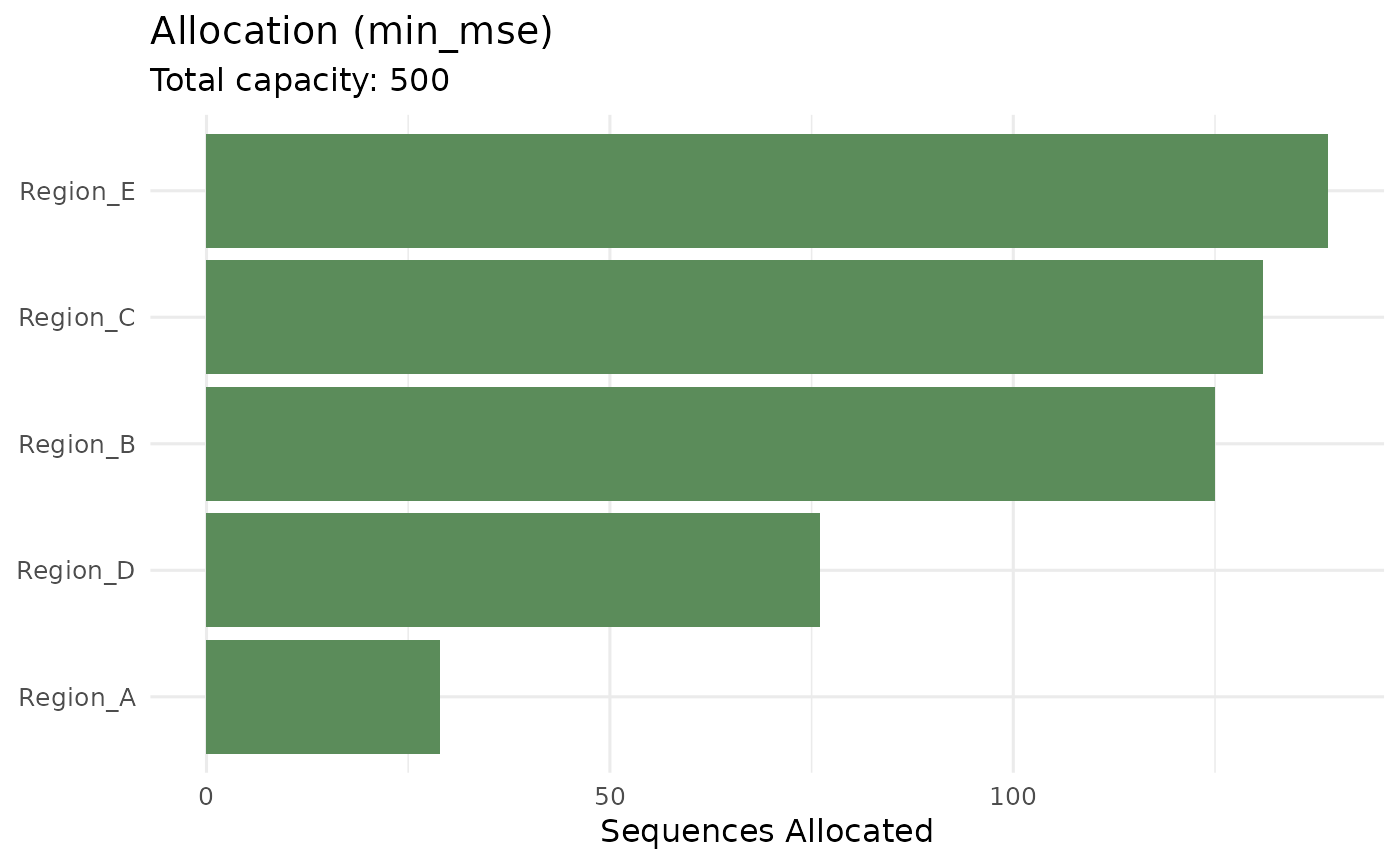
Plot allocation plan
Examples
sim <- surv_simulate(n_regions = 5, n_weeks = 10, seed = 1)
d <- surv_design(sim$sequences, ~ region,
                 sim$population[c("region", "seq_rate")], sim$population)
a <- surv_optimize_allocation(d, "min_mse", total_capacity = 500)
surv_plot_allocation(a)