Plot a lineage frequency forecast
Usage
# S3 method for class 'lfq_forecast'
autoplot(object, ...)Examples
# \donttest{
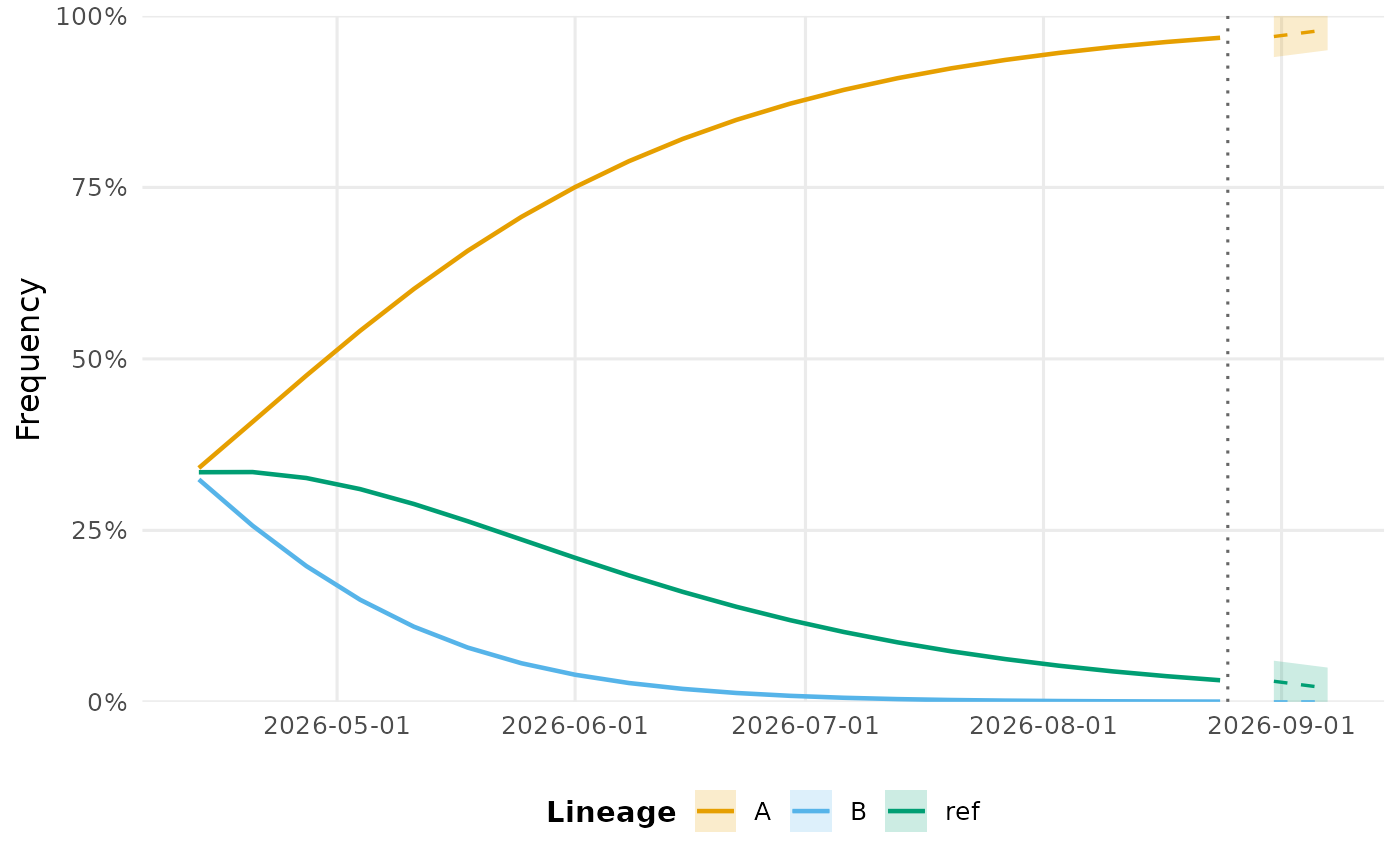
sim <- simulate_dynamics(n_lineages = 3,
advantages = c("A" = 1.2, "B" = 0.8), seed = 1)
fit <- fit_model(sim)
fc <- forecast(fit, horizon = 14)
autoplot(fc)
#> Warning: A <numeric> value was passed to a Date scale.
#> ℹ The value was converted to a <Date> object.
 # }
# }