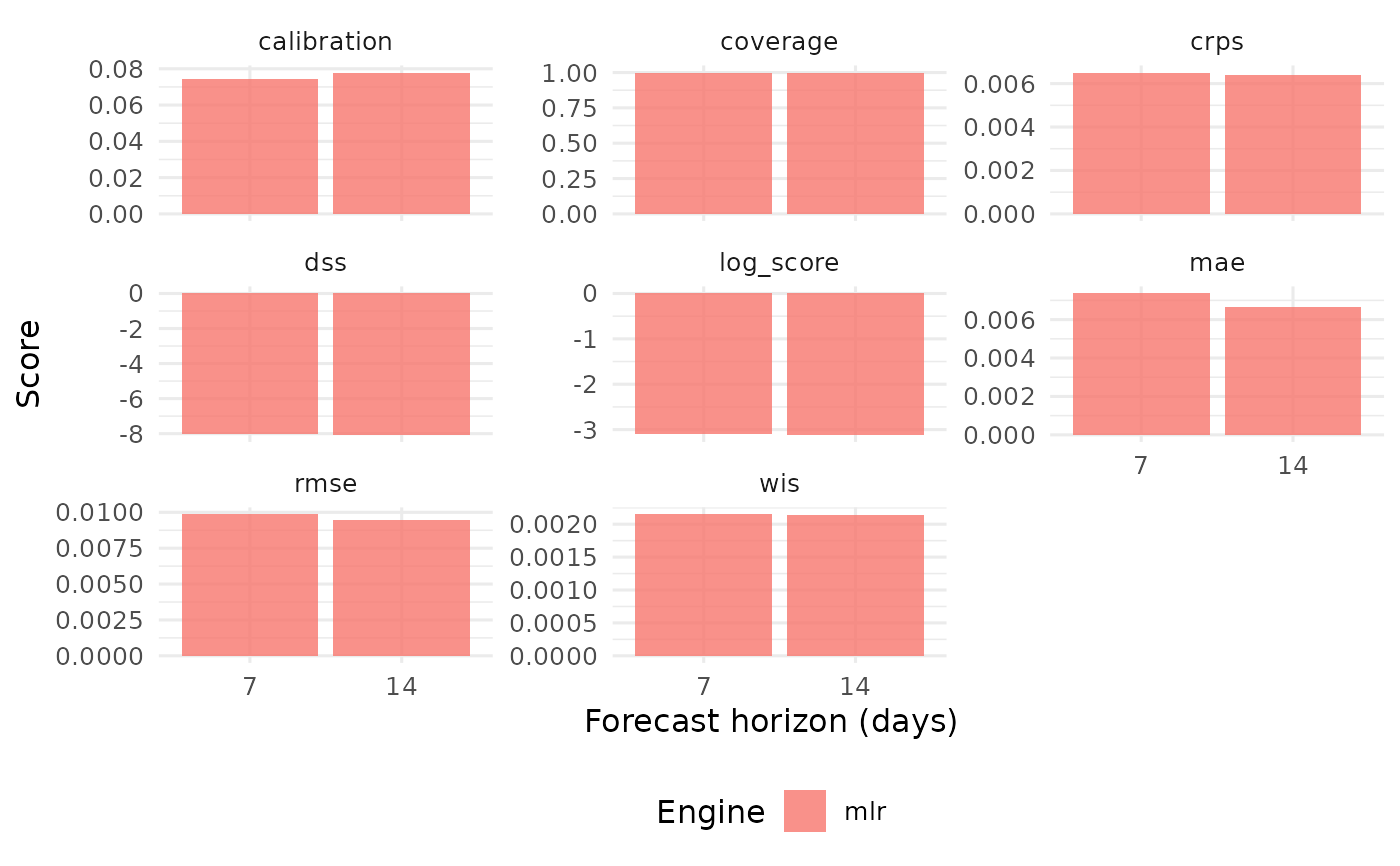
Creates a panel plot of forecast accuracy by engine and horizon.
Arguments
- scores
Output of
score_forecasts().
Examples
# \donttest{
sim <- simulate_dynamics(n_lineages = 3,
  advantages = c("A" = 1.2, "B" = 0.8),
  n_timepoints = 20, seed = 1)
bt <- backtest(sim, engines = "mlr",
  horizons = c(7, 14), min_train = 42)
sc <- score_forecasts(bt)
plot_backtest(sc)

# }
# }